Project Overview
Problem Statement:
Flory, a manufacturer of agricultural machinery, faced challenges in efficiently collecting and analyzing machine data across their global operations. This hindered their support and engineering team's ability to quickly identify performance issues, leading to potential downtime, increased costs, and less informed decision-making. To address these pain points, we created a dashboard interface and analysis tool providing Flory with real-time insights into their machinery's health and performance. 
My Role: As the senior designer on this project, I brought a wealth of experience in crafting user-centered interfaces for industrial clients. This expertise, combined with my technical background, allowed me to bridge the gap between design and development. I actively collaborated with the product manager to conduct UX research, participate in client meetings, and develop deep insights into Flory's needs. My role extended beyond traditional design; I ensured a seamless translation of user requirements into intuitive interfaces that enhanced Flory's data analysis capabilities.
Project Goals: This project aimed to revolutionize Flory's data gathering and analysis processes for their sweeper and harvester machinery. Our key objectives were to Automate Data Collection: Eliminate manual data entry by establishing a system for remote, real-time transmission of machine data directly to our analysis tool. Empower Flory's Service Teams: Provide technical support staff with a robust dashboard presenting insights on: Common error codes and their root causes High-demand repair parts Performance trends across dealerships and clients Temporal patterns of errors and malfunctions Enable Engineering Insights: Equip Flory's engineering team with tools to: Deep-dive into specific errors and associated conditions View aggregated machine state data Identify potential areas for design improvement based on parameter deviations
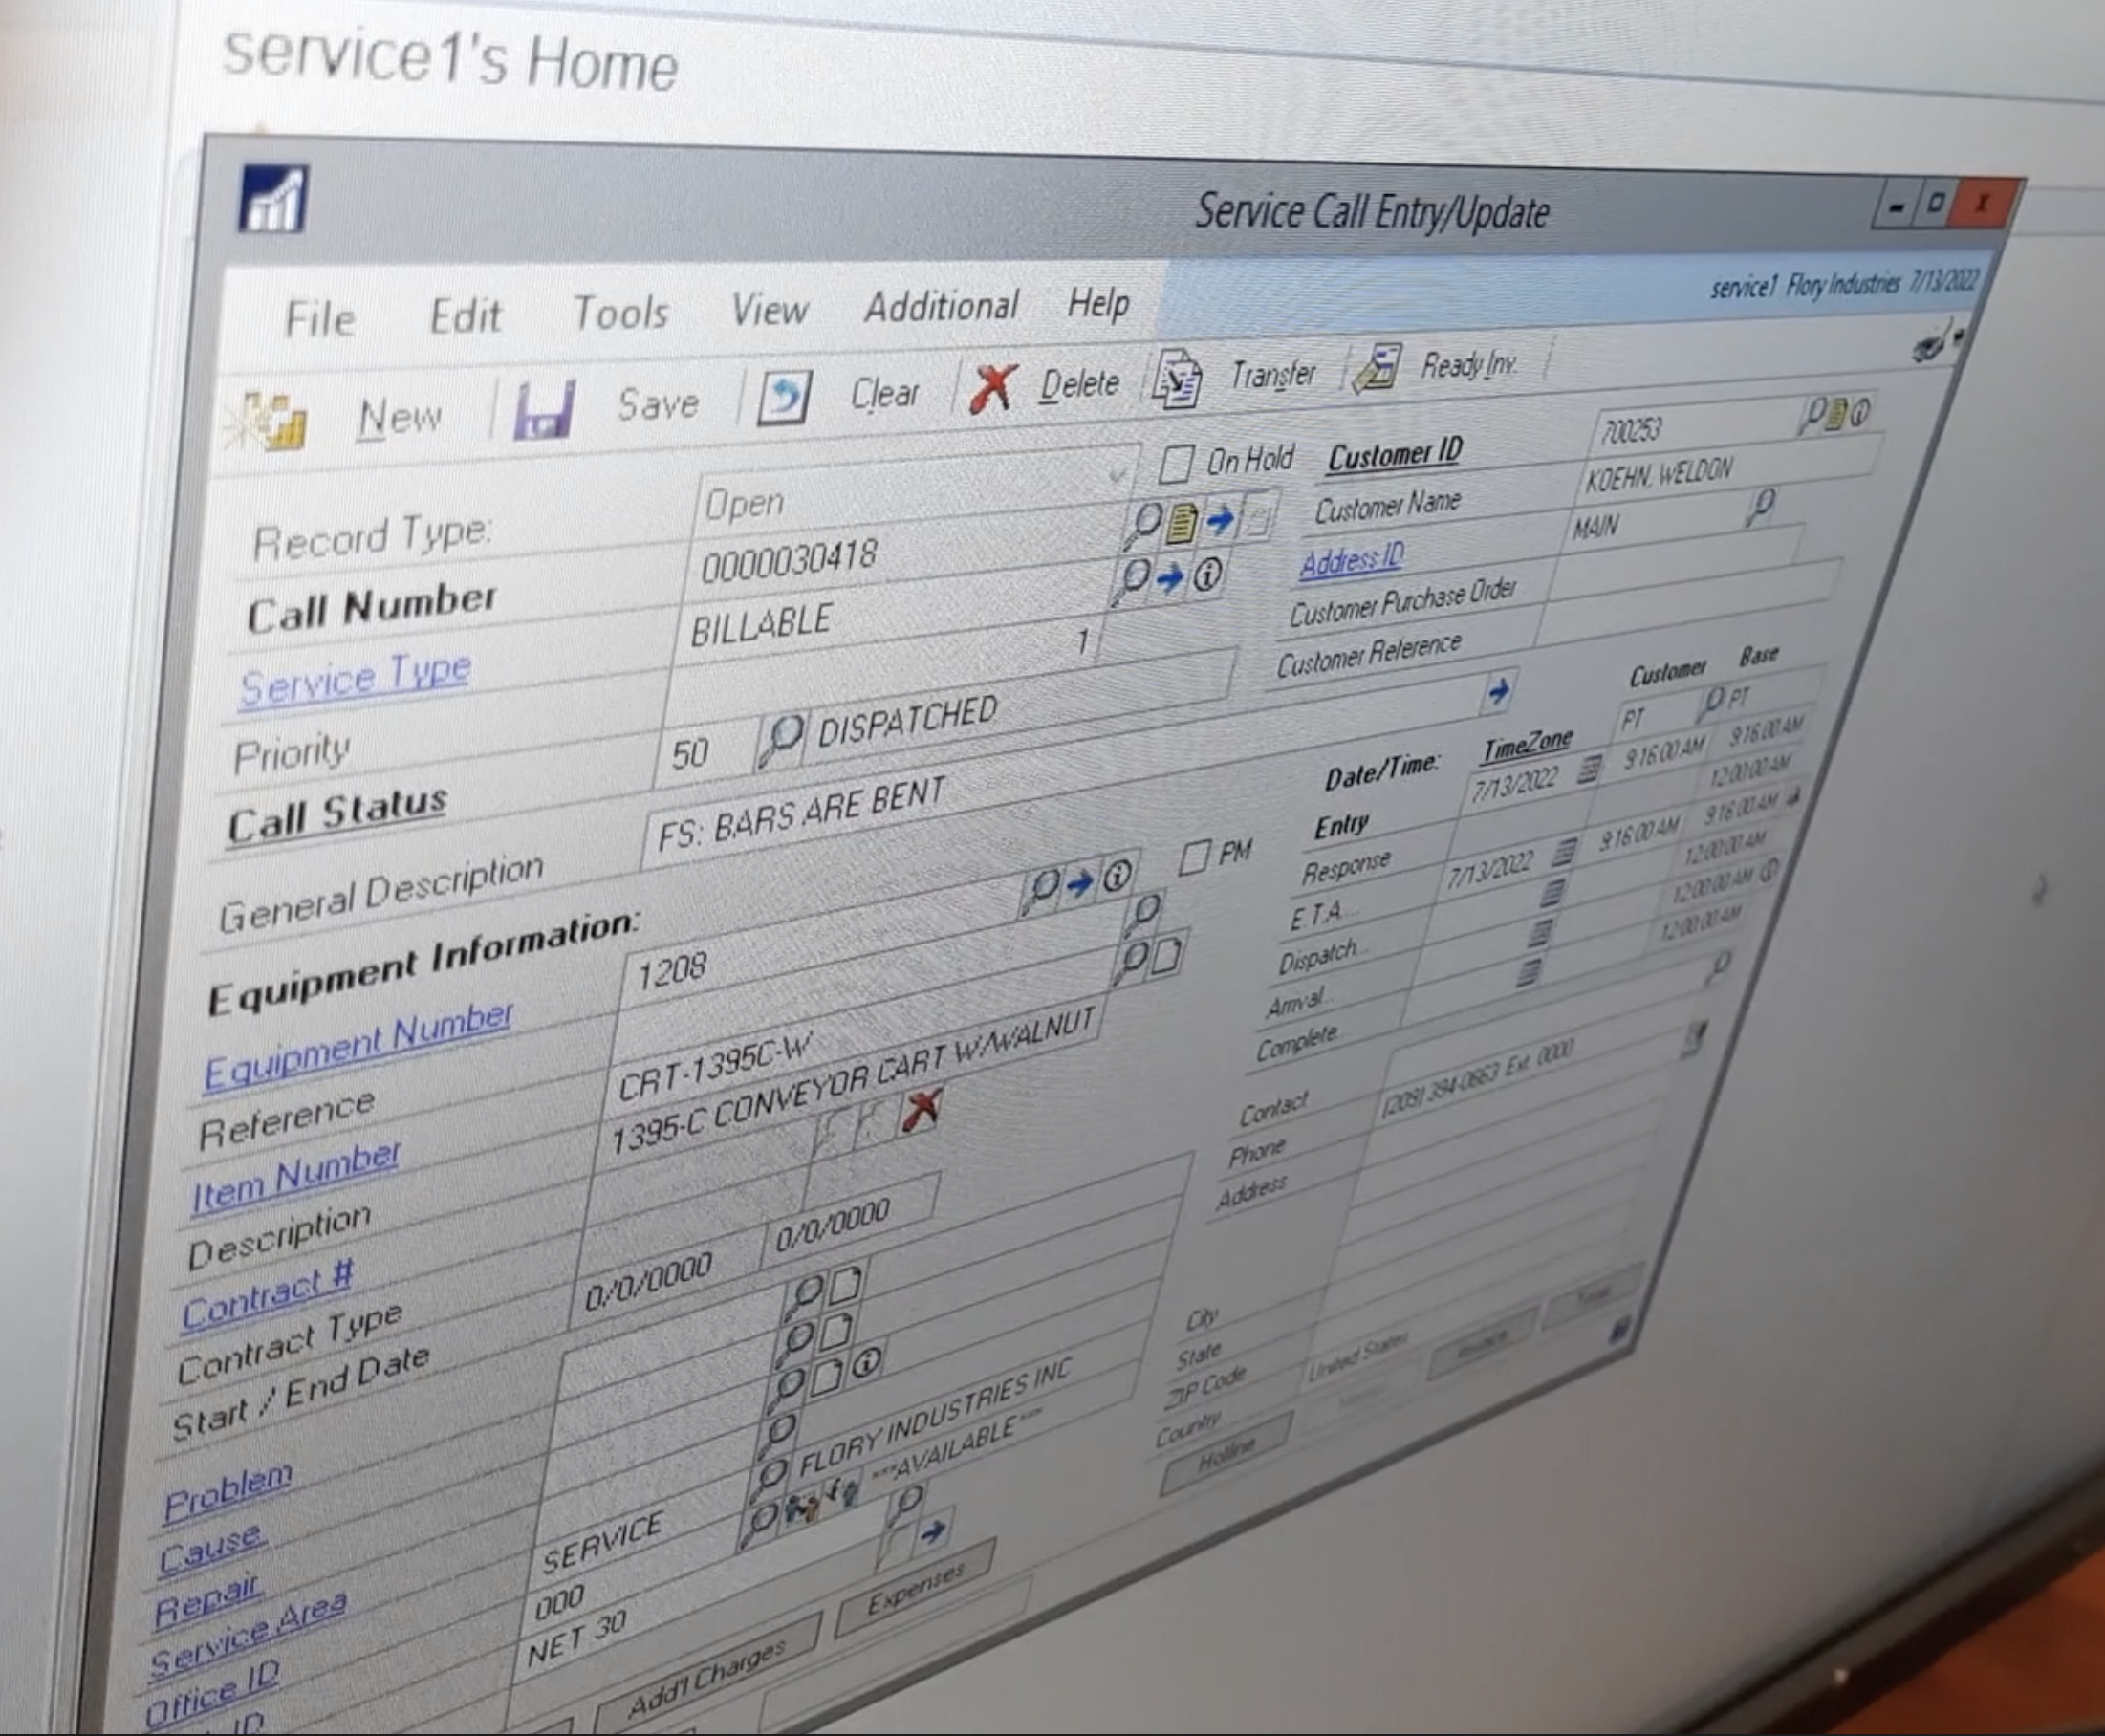
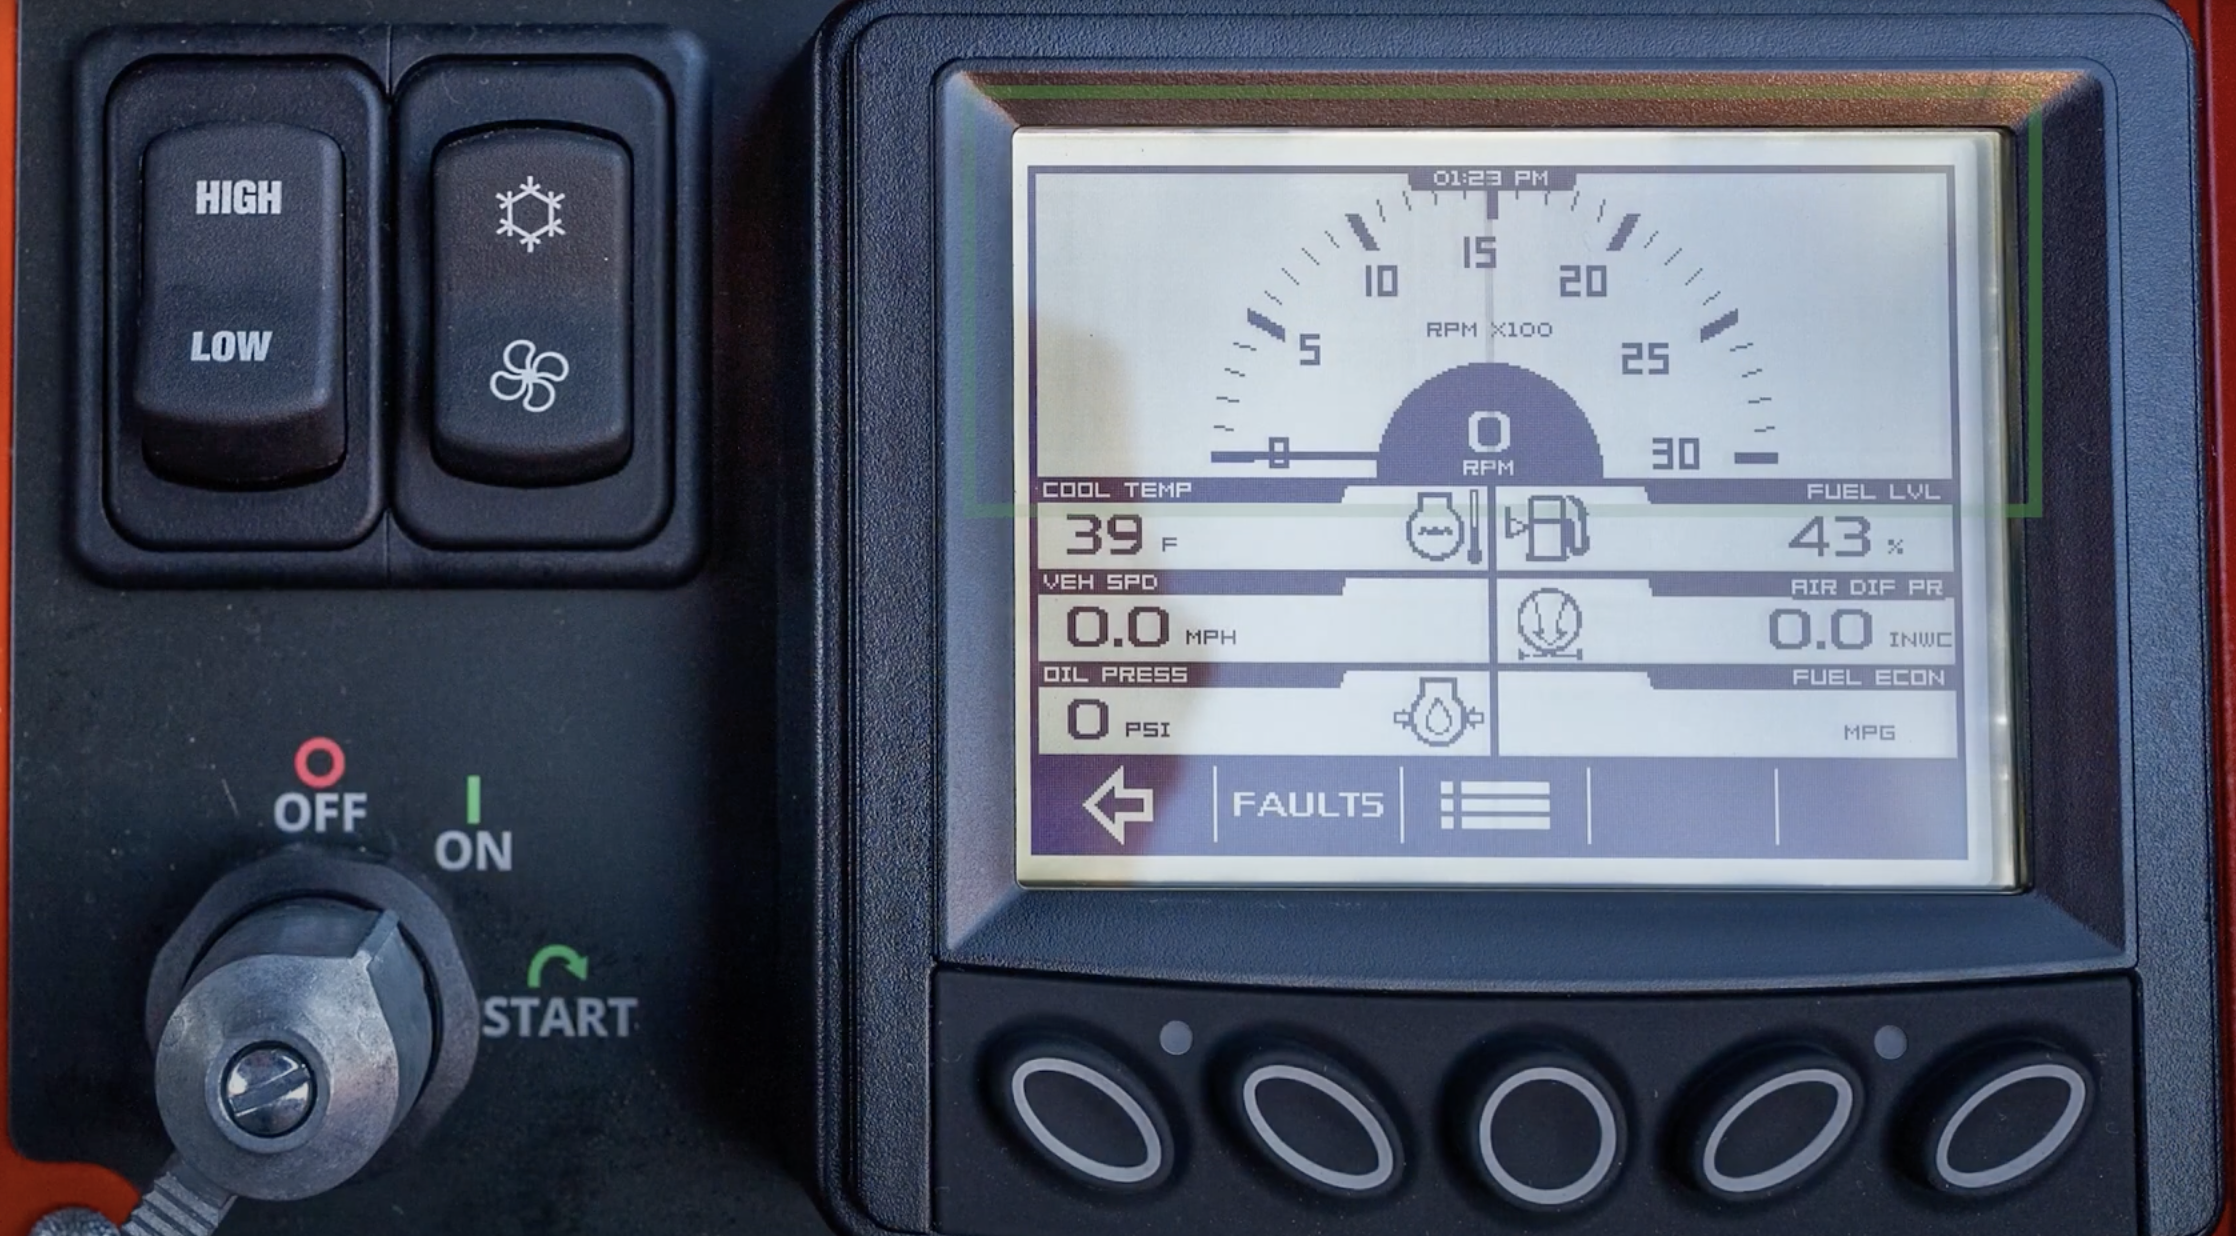
Target Audience: This project's dashboard and analysis tool were designed to serve two distinct user groups within Flory: Service Personas: Technical advisors and support staff were the primary audience. The tool was aimed at streamlining troubleshooting, improving response times, and aiding in proactive maintenance recommendations. Engineering Team: The tool also provided valuable insights to Flory's engineers, allowing them to analyze error patterns, assess component lifespans, and identify areas for potential design improvements to increase machine reliability and efficiency.

Design Process
Research: To craft a deeply user-centric solution, I conducted a multi-faceted research phase. This involved in-depth interviews with Flory, revealing critical pain points like slow communication between support and operators in the field, often hampered by language barriers. I constructed comprehensive user personas, highlighting the distinct needs of service technicians and engineers. Competitive analysis uncovered a lack of intuitive interfaces tailored for agricultural machinery data. Finally, I delved into the proactive maintenance approach, recognizing the potential to reduce downtime and optimize machine lifespans.


Key Insights: Inefficient Field Communication: Slow and unclear communication between support and operators led to extended troubleshooting times and misdiagnosis. Language Barrier Challenges: Communication difficulties exacerbated problem resolution and accurate instruction delivery. Lack of Data Aggregation: Without centralized data, support teams couldn't identify recurring issues, leading to repeated equipment failures and extended downtime.
Ideation: To address the challenges uncovered in the research phase, I employed various brainstorming techniques to generate solutions focused on efficiency and clarity. A key concept emerged: mirroring Flory's existing phone support workflow while streamlining the process. Instead of lengthy data collection calls, operators would provide minimal identification details, allowing support personnel to instantly access relevant machine data. Recognizing the value of temporal context, we incorporated a timeline-based approach into our ideation. This timeline would visualize machine data, offering rich insights into operator behavior and potential patterns leading to malfunctions. This led to the development of sketches, wireframes, and low-fidelity prototypes that prioritized intuitive data presentation.

Prototyping & Testing: I employed an iterative prototyping approach, starting with low-fidelity sketches to quickly explore timeline-based data visualization concepts. These evolved into mid-fidelity wireframes, allowing us to test the core user flow of operator identification and machine data retrieval. User feedback was gathered throughout, emphasizing the need for clear visual hierarchy and intuitive filtering options. Inspired by this feedback, high-fidelity prototypes were developed, incorporating the following:
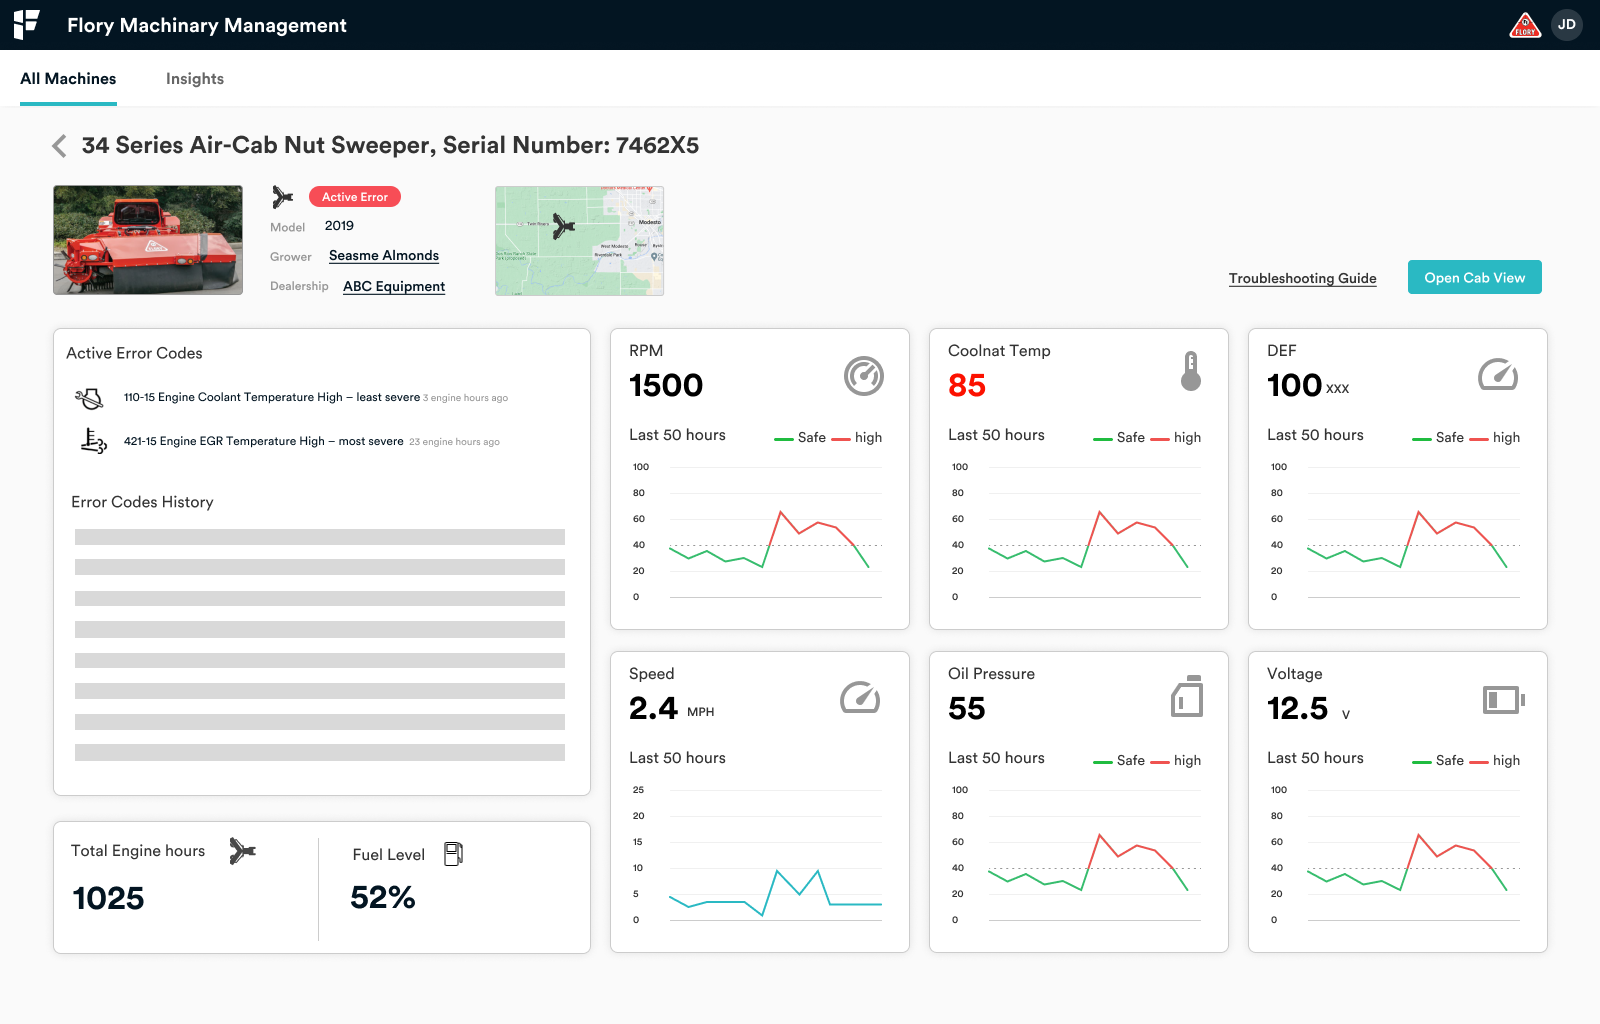
Timeline Prototypes:
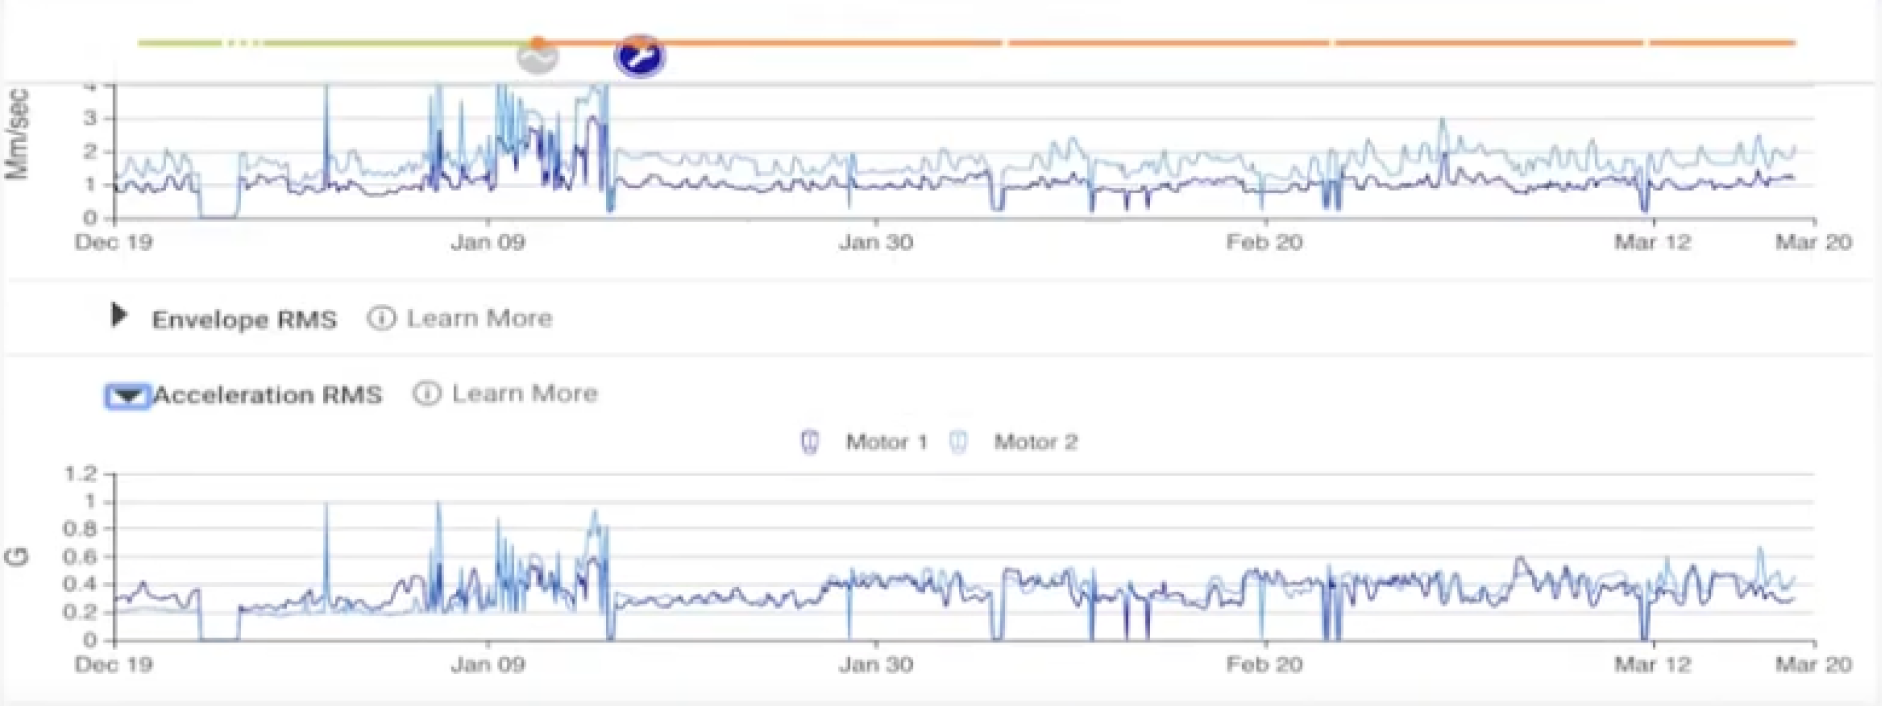
Diagnostic Tools Exploration:

Key Insights
Communication Bottlenecks: The current support workflow relies heavily on inefficient and time-consuming phone communication between support staff and field operators. Language barriers further complicate issue diagnosis and resolution.
Data Fragmentation: Flory lacks a centralized data repository, hindering the identification of recurring equipment failures and proactive maintenance opportunities.
Missed Proactive Opportunities: Without aggregated data and predictive analytics tools, Flory's support model remains largely reactive, leading to extended downtime and potentially avoidable repairs.
Desire for Real-time Insights: Flory expressed a strong need for real-time machine data visualization, facilitating faster troubleshooting and enabling a more data-driven support approach.
Outcomes & Impact
Implications for Design These insights underscore the following design priorities:
Streamlined Data Input: Minimize the need for manual data entry from operators, shifting focus to rapid machine data retrieval by support teams.
Intuitive Visualizations: Prioritize clear, timeline-based data displays that empower support staff to quickly identify patterns and potential issues.
Language-agnostic Interface: Design elements should focus on visual indicators and minimize reliance on text-heavy instructions to overcome communication barriers.
Real-time Focus: Prioritize the display of real-time machine status and alerts, enabling immediate action on critical issues.


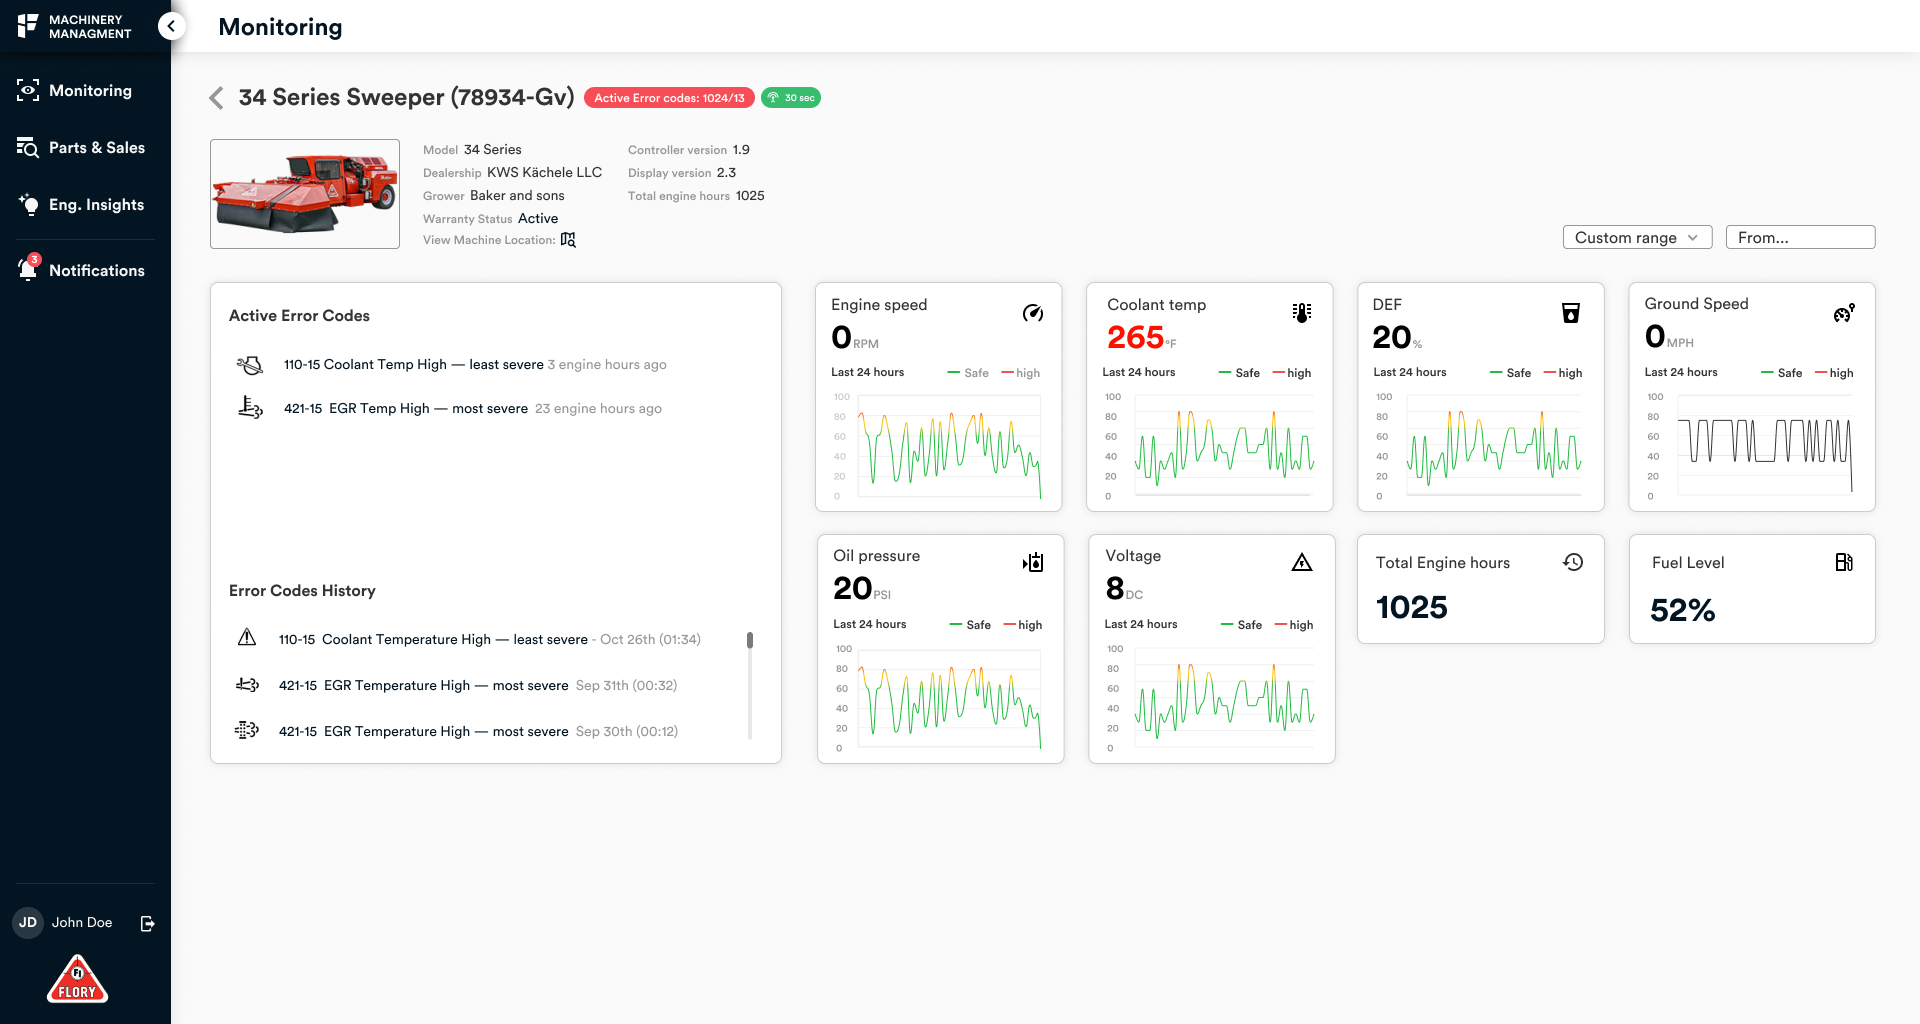

Metrics: Our solution significantly improved Flory's support efficiency. By automating data collection and providing intuitive visualizations, we reduced support call times by over 50%. This streamlined workflow shortened response times, empowering support personnel to address issues proactively. The ability to visualize machine data trends enabled predictive maintenance capabilities, optimizing support levels and minimizing future downtime.
Learnings & Future Opportunities: This project successfully streamlined Flory's support processes, but it also opened avenues for continued growth. Integrating part inventory monitoring with our existing data analysis tool would allow for optimized stock levels and proactive part replacement, further reducing downtime. Additionally, empowering the engineering team with aggregated machine data enables a macro-level view. They could identify common failure patterns across different client configurations or operating environments, driving data-informed design improvements and increasing overall machine reliability.
